
THE BENCHMARKS WE CHOOSE DETERMINE WHETHER WE WIN OR LOSE…
We can always find someone doing better (or worse)
Dan Egan, director of finance and behavioral psychology at Betterment, wrote an excellent piece, “How to lose by beating the (wrong) benchmark”, about why the standard we choose to measure ourselves against matters so much.
In general, we’re relative pricers of our happiness for the simple reason that there are few absolute measures of happiness.
When it comes to pricing goods or services, price is relative – relative to the prices of other goods or services or what people are willing to pay.
Our happiness is the same. How do we figure out what amount of “it” – money and possessions, a relationship partner and family, friends, health, work, leisure, faith, good works – makes us happy?
It’s all relative. And we choose what it is relative to.
The standards we choose – what we are benchmarking ourselves against – are often poorly chosen. We benchmark against other people. We benchmark against our own past peaks or valleys. We can always find some standard against which we are doing poorly. Or against which we are doing well.
Choose our benchmarks poorly and we will learn the wrong lessons from our experience.
Egan summed up the right way to benchmark:
“We should be benchmarking and improving on our own performance relative to our own goals. Not others.
Every day we are presented with benchmarks that have nothing to do with our goals, yet challenge us to beat them. It takes real thoughtfulness and control to craft a benchmark for yourself, and measure performance relative to it, not others.”
Egan focuses on how investors benchmark, but he applies the concept to other situations. (For example, after having resumed swimming regularly, the temptations of benchmarking against the speed of others in the pool.)
The difficulty in benchmarking against others is that it can quickly turn an exercise in improvement into motivated reasoning.
Think about it: If we want to beat ourselves up, we’ll always be able to find someone doing better than us. Likewise, if we want to feel we’re succeeding, we can find someone doing worse.
As Egan says, “If you want to find something that beat your portfolio over some time horizon, you can.”
Picking better benchmarks creates a smoother path to self-improvement.
To sum up, from Egan:
“A big benefit of good personal benchmarks is that they make beating the benchmark much more common, controllable, and rewarding …. [I]n the case that I am successful, I can attribute more of my success to my actions, rather than randomness.
And feeling good about making progress at a personal level means you’re more likely to continue to make progress. It makes personal progress itself addictive.”
THE GOAT SOLUTION
Benchmark against process, not outcomes
This traditional Jewish story, from a tweet by Vicki Boykis, is a lesson in how benchmarks affect our happiness. (There are, I’m sure, other versions of this story. She credited a version available on BeliefNet.com. She abridged the story and I’m doing the same in my retelling.)
A poor farmer goes to a rabbi with a problem. “My wife and children are living in a small house and it’s unbearable. Life couldn’t get worse.”
The rabbi asked, “Do you have a goat?” The farmer, puzzled, nodded.
“Move the goat into your house with your family.”
He didn’t dare question the reasoning of the rabbi, who was legendary for his wisdom.
Over the objections of his family, he brought the goat to live in the house, and it was a disaster.
The goat smashed the furniture, ate everything in sight, and smelled … like a goat.
He returned to the rabbi, panic-stricken. Life had never been more horrible. He needed something – anything – to relieve his family’s suffering.
The rabbi said, “Remove the goat.”
It’s a silly joke but it reveals something deep about human nature.
We tend to measure ourselves against our latest peak or valley. If we have a recent downturn, we’re sad – even if we are doing better overall.
A recent uptick creates happiness, even if our trendlines are down overall.
It’s better to think of ourselves as a long-hold happiness stock. This helps us get a 10,000-foot view of how we are doing over the long run.
Otherwise, we watch the stock ticker go up and down, and our happiness goes up and down with it.
This ticker-watching causes us to pick unproductive benchmarks. Instead of measuring ourselves against our progress toward a goal, looking toward a long-term horizon, the ticker is all we can see.
Ask somebody about to play blackjack their goal and they’ll probably say, “my goal is to win.”
We know they’re more likely to lose than win, but that’s a reasonable goal: winning feels better than losing, and winning more money feels even better (and losing more money feels even worse).
How is it, then, that they can walk out of the casino unhappy about winning $100 or happy about losing $100?
Because the path we take really matters as our most recent highs and lows anchor us to new benchmarks.
If we were quickly ahead by $1,000 and gradually lost during the rest of the session, we could walk out a $100-winner and feel like a loser.
Or we could be down $1,000, go on a huge winning streak at the very end, and feel like paying for everyone’s drinks in our euphoria over rebounding to a mere $100 loss.
If you’re happy about a $100 loss and sad about a $100 win, you have lost sight of your goals.
What be benchmark against really matters for how we process outcomes. And that determines the lessons we learn.
PROBABILITIES IN PICTURES
Illustrated by Math with Bad Drawings (the book and the website)
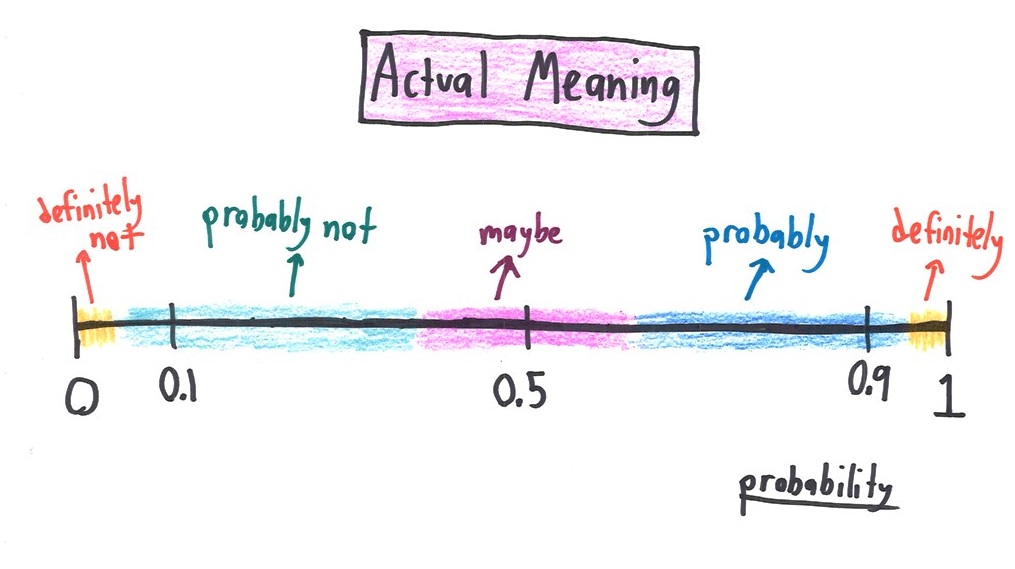
Ben Orlin, creator of the website Math with Bad Drawings and author of a book by the same name, offer this hilarious illustration of inconsistency in the way people interpret words that denote probabilities.
Orlin’s funny take reminded me of how Andrew Mauboussin and Michael Mauboussin demonstrated, in HBR, the different meanings people give terms such as “likely.” (I wrote about their survey and the results in a newsletter item last July, “How Likely is ‘Likely’?”.)
In “What Does Probability Mean in Your Profession?”, he starts with a basic representation of a range of probabilities:
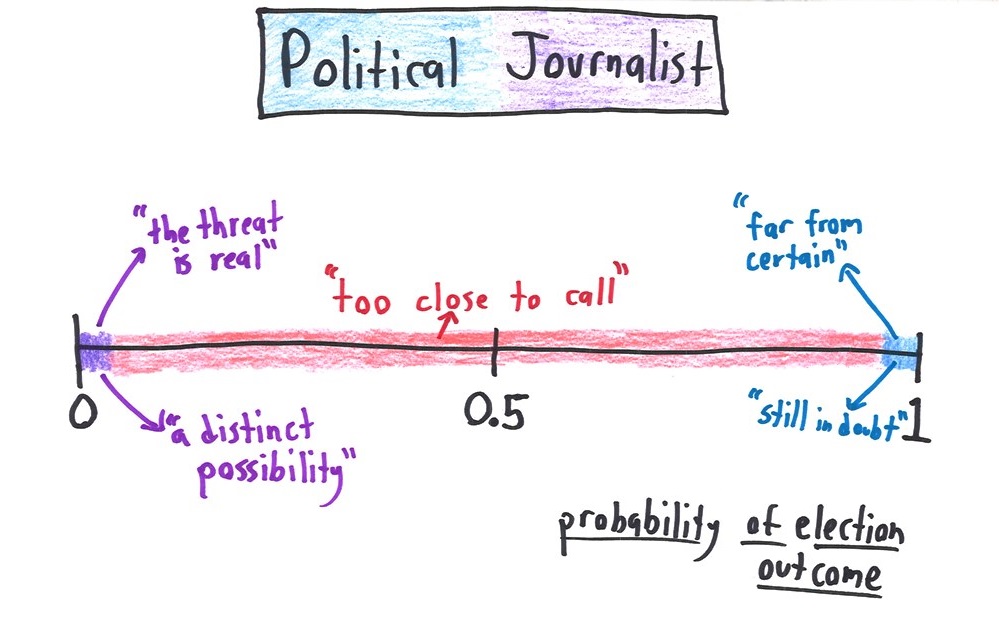
In contrast, this is what probabilities sound like coming from a political journalist:
Or what they sound like coming from a local news anchor, describing the latest terrifying story:

He also illustrates what probabilities sound like coming from investment bankers, philosophers, weather forecasters, a Mission Impossible agent, and the captain of the Millennium Falcon.
On a more serious note, Orlin’s site does a great job of helping you visualize abstract mathematical concepts.
Highly recommended.
WHAT PROBABILITIES FEEL LIKE
Seeing Theory – A wonderful shortcut for visualizing probability
Probabilities are hard to feel.
We can’t “see” expected value. We are bad statistical aggregators. We don’t sit back and wait for a large enough sample size to make a judgment about how often something will happen.
What we can actually see and feel is a single outcome.
When someone says, “The chances are 50-50, it will either happen or it won’t,” it might seem facetious but this how our minds work: we think in single outcomes. We don’t think in the aggregate.
Spend enough time at a poker table, though, and you will start to feel in your gut different probabilities. Once you have played out enough 80%-20% or 66%-33% hand match-ups in rapid succession, you develop an instinct for what those probabilities mean.
Poker is like living in a Monte Carlo simulation.
There aren’t many places like poker where you can really EXPERIENCE probabilities in an environment with a fast, tight feedback loop and the same situations playing out over and over again.
Seeing Theory is a website and textbook-in-progress, created by Daniel Kunin and colleagues, that offers such an environment. It includes a series of interactive visualizations designed to make statistical concepts more accessible.
It’s like giving you the equivalent of years at the poker table.
What is expectancy? Or variance? Or conditional probability?
Seeing Theory explains those (and other) concepts and gives you a chance to actually run simulations to develop a feeling for what those things really mean. Visualizing is a tool that makes those concepts more concrete.
Pulling back that curtain can help us become better decision makers.
How many flips does it take for a coin to land exactly 50%-heads, 50%-tails? By actually running this, you can see what happens if you flip a coin 10 times, or 100, or 1,000.
As one example, the site offers you the opportunity to roll a 6-sided die numerous times to watch the running mean converge on the expectation.
The average roll would be 3.5, but this time through, after 75 rolls, the mean dropped below the expectation. It took until roll 1,199 for the mean to reach 3.5.

Unless you’re playing poker, it’s difficult to visualize such things. Seeing Theory makes it easier. You should really check it out and play with the tools.
THIS WEEK’S VISUAL ILLUSION
The Hering Illusion, thanks to Michael Bach’s website

Michael Bach’s website, “134 Visual Phenomena & Optical Illusions,” is a wonderful collection with explanations, variations, historical backgrounds, and interactive tools to peek behind the illusions. In this one, you can click to make the oblique lines disappear, leaving just the parallel red lines.